Tuning Out the Noise
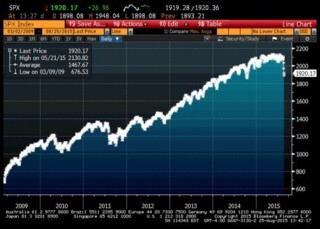
Over the last five trading days, ending Monday, August 24th, 2015, the S&P 500 fell by 9.95%. This marked the biggest drop for the U.S. stock market since 2011. After nearly four years of relative calm and low volatility, we were once again reminded that there is no such thing as a free lunch. If you want the higher returns provided by stocks versus cash and bonds, you have to live with the increased volatility. The Bloomberg chart above shows the daily price changes for the S&P 500 going back to March of 2009, when the index reached its Great Recession low.
Since the March 9th, 2009 bottom, the S&P 500 has advanced from 676.53 to 1,867.61 on August 25th, 2015. Including reinvested dividends, this represents an 18% annualized return. During this same period, the bond market (as measured by the Citigroup 1-10 Year Treasury Bond Index) provided an annualized return of 2.46% while annualized money market returns were less than 0.25%. However, these outstanding returns for stocks didn’t come without several pullbacks. The table below shows that there were ten peak to trough corrections of at least 5% during this time period, including five periods with corrections greater than 9%. While the stock market decline over the last several days has not been pleasant it certainly is not an abnormal event.
Time Period Peak to Trough S&P 500 Contributions
January 14, 2010 to February 8, 2010 -7.99%
April 23, 2010 to July 2, 2010 -15.99%
May 2, 2011 to October 3, 2011 -19.25%
October 28, 2011 to November 25, 2011 -9.84%
April 2, 2012 to June 1, 2012 -9.94%
September 4, 2012 to November 15, 2012 -7.67%
May 17, 2013 to June 24, 2013 -5.66%
December 31, 2013 to February 3, 2014 -5.76%
September 19, 2014 to October 15, 2014 -7.24%
May 21, 2015 to August 24, 2015 -11.15%
Over the last twenty-plus years, we have been through several major stock market declines from the 1998 Russian financial crisis to the dot.com bust to the Great Recession. During times of market stress the following tenets have served us well:
[1] Don’t fixate on all the daily “noise.” One of Mike’s economics professors in college, Dr. John Naylor, used to say that they have to print the Wall Street Journal every day so they are always going to fill it with stories and some are more useful than others. The same can be said about the hourly programming on CNBC.
[2] Don’t panic. Base asset allocation and investment decisions on fundamental research and analysis and your long-term investment strategy and not knee-jerk reactions. Yes, the stock market is not cheap by historical measures, but given today’s low interest rates and inflation it doesn’t appear to be at extreme levels of overvaluation either. A long-term investment strategy should not be adjusted on a daily or weekly basis.
[3] Market timing does not work. Volatility may lead some investors to move money out of the stock market and “sit on the sidelines” until things “calm down.” This approach reduces the volatility of a portfolio but it creates several other problems: When do you get back in the market? You must make two correct decisions back-to-back (i.e. when to get out and when to get back in). By going to the sidelines you may be missing a significant market rebound (see the S&P 500 chart on the previous page).
[4] We are long-term investors in the shares of quality businesses. We do not know what the market will do tomorrow, next week, next month or next year. Nor does anyone else. Stocks could drop another 10% from here, or another 25%, etc. What we do know is that high quality companies providing necessary products and services will be around in the future and longer-term their share prices will reflect the underlying earnings that the companies are generating. If you invest in businesses that can earn more money in the future than they are earning today, you should see the stock prices of these businesses move up over the long-term to reflect the higher earnings power of the businesses.
[5] Diversification is the best defense for the uncertainties facing us today and in the future. An important reminder from the Great Recession is that diversification works. While stocks were falling significantly in the fall of 2008, high quality bonds were going up in price due to the “flight to safety” buying. Even though we had the worst decline in the stock market in seventy years with the S&P 500 declining by 57% from peak to trough, a 60/40 stock/bond portfolio recovered its pre-correction value in approximately twenty-one months.1
At times like these it is important to stay calm and focus on fundamentals and your long-term investment strategy versus the daily and hourly “noise.” As always, please contact us if you have any questions or concerns.
1Assumes monthly rebalancing of a portfolio invested 40% in the Citigroup 1-10 Year Treasury Index, 50% in the S&P 500 and 10% in the MSCI EAFE Index.
Reproduction
or distribution of this material is prohibited and all rights are reserved.
Past performance is no guarantee of future performance. All investments contain risk and may lose value. Any views expressed within this document are the views of AMI Investment Management and/or the authors. They are subject to change at any time without notice. Any graphs, charts or formulas included within this document that depict historical relationships may not be valid during future periods and should not be relied upon to make investment decisions. This material is distributed for informational purposes only and should not be considered as investment advice or as a recommendation of any particular investment security, strategy or investment product.
